Get started with monitoring your application in GitLab
Monitoring is a crucial part of maintaining and optimizing your applications. GitLab observability features help you track errors, analyze application performance, and respond to incidents.
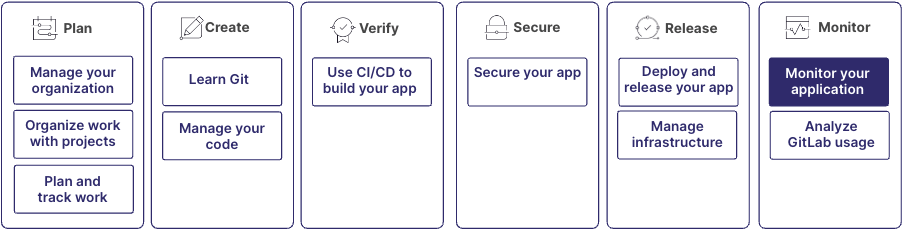
These capabilities are part of the larger DevOps workflow:
All of these features can be used independently. For example, you can use tracing or incidents without using error tracking. However, for the best experience, use all of these features together.
Step 1: Determine which project to use
You can use the same project for monitoring that you already use to store your application's source code.
For large applications with multiple services and repositories, you should create a dedicated project to centralize all telemetry data collected from the different components of the system. This approach offers several benefits:
- Data is accessible to all development and operations teams, which facilitates collaboration.
- Data from different sources can be queried and correlated in one place, which accelerates investigations.
- It provides a single source of truth for all observability data, making it easier to maintain and update.
- It simplifies access management for administrators by centralizing user permissions in a single project.
To enable observability features, you need administrator or the Owner role for the project.
For more information, see:
Step 2: Track application errors with error tracking
Error tracking helps you identify, prioritize, and debug errors in your application. Errors generated by your application are collected by the Sentry SDK, then stored on either GitLab or Sentry back ends.
For more information, see:
Step 3: Monitor application performance with tracing, metrics, and logs
Enable beta features
The following features are available in closed beta:
- Distributed tracing: Follow application requests across multiple services.
- Metrics: Monitor application and infrastructure performance metrics, like request latency, traffic, error rate, or saturation.
- Logs: Centralize and analyze application and infrastructure logs.
To make these features available, an administrator must enable the feature flag
named observability_features for your project or group. After these features are enabled, you can set up data collection.
Instrument your application with OpenTelemetry
Traces, metrics, and logs are generated from your application and collected by OpenTelemetry, then stored on the GitLab back end.
OpenTelemetry is an open-source observability framework that provides a collection of tools, APIs, and SDKs for generating, collecting, and exporting telemetry data. The OpenTelemetry Collector is a key component of this framework.
You can collect and send telemetry data to GitLab using either direct instrumentation or the OpenTelemetry Collector. This table compares the two methods:
| Method | Pros | Cons |
|---|---|---|
| Direct instrumentation | - Simpler setup - No infrastructure changes |
- Less flexible - No data sampling or processing - Can generate high volume of data |
| OpenTelemetry Collector | - Centralized configuration - Enables data sampling and processing - Controlled volume of data |
- More complex setup - Requires infrastructure changes |
You should use the OpenTelemetry Collector for most setups, especially if your application is likely to grow in complexity. However, direct instrumentation can be simpler for testing purposes and small applications.
Direct instrumentation
You can instrument your application code to send telemetry data directly to GitLab without using a collector.
Choose a guide based on your programming language or framework:
For other languages, use the appropriate OpenTelemetry API or SDK.
Using the OpenTelemetry Collector (recommended)
For complex application setups, you should use the OpenTelemetry Collector.
What is the OpenTelemetry Collector?
The OpenTelemetry Collector acts like proxy that receives, processes, and exports telemetry data from your application to your monitoring tools such as GitLab Observability. It is opensource and vendor-neutral, which means you can use with any compatible tools and avoid vendor lock-in.
Benefits of using the Collector:
- Simplicity: Application services send data to only one destination (the Collector)
- Flexibility: Add or change data destinations from a single place (if you use multiple vendors)
- Advanced features: Sampling, batching and compression of data
- Consistency: Uniform data processing
- Governance: Centralized configuration
Configure the OpenTelemetry Collector
-
Choose a deployment method (agent or gateway)
-
Configure data collection Add the GitLab endpoint as an exporter in the Collector
config.yamlfile:exporters: otlphttp/gitlab: endpoint: https://observe.gitlab.com/v3/<group_id>/<project_id>/ingest/ headers: "private-token": "<your_token>" service: pipelines: traces: exporters: [spanmetrics, otlphttp/gitlab] metrics: exporters: [otlphttp/gitlab] logs: exporters: [otlphttp/gitlab]Replace the placeholders with the following values:
-
<group_id>: The top-level group ID for your project. On the group homepage, in the upper-right corner, select the vertical ellipsis ({ellipsis_v}), then Copy group ID. -
<project_id>: The project ID. On the project homepage, in the upper-right corner, select the vertical ellipsis ({ellipsis_v}), then Copy project ID. -
<your_token>: An access token created in the project with theOwnerrole andread_apiandwrite_observabilityscopes. Create a token at the project's Settings > Access tokens.
-
-
Instrument your application to send data to the Collector. Use the language-specific guides above, but point to your Collector instead of GitLab. For example, if your application and your Collector are on the same host, send your application to this URL:
OTEL_EXPORTER_OTLP_ENDPOINT=http://localhost:4318 \
Test your setup
After setting up data collection, you can visualize the collected data in your project by viewing the Monitor navigation menu. Use the Tracing, Metrics, and Logs pagesto access this information. These features work together to provide a comprehensive view of your application's health and performance, helping you troubleshoot detected issues.
For more information, see:
Step 4: Monitor infrastructure with metrics and logs
To monitor your applications' infrastructure performance and availability first install the OpenTelemetry Collector as described previously. Then, based on your setup, you can use various methods to gather metrics and logs data:
- For host-level, OS metrics: Use the OpenTelemetry Collector with a receiver like Host Metrics. This receiver collects CPU, memory, disk, and network metrics from the host system.
- For cloud-based infrastructure: Use your provider's monitoring solution integrated with OpenTelemetry. For example, receivers like AWS CloudWatch or Azure Monitor.
- For containerized applications: Use receivers like Docker stats or Kubelet stats.
- For Kubernetes clusters: Follow this external guide.
Step 5: Manage alerts and incidents
Set up incident management features to troubleshoot issues and resolve incidents collaboratively.
For more information, see:
Step 6: Analyze and improve
Use the data and insights gathered to continuously improve your application and the monitoring process:
- Create insight dashboards to analyze issues or incidents created and closed, and assess the performance of your incident response.
- Create executable runbooks to help engineers on-call remediate incidents autonomously.
- Regularly review your monitoring setup and adjust sampling thresholds or add new metrics as your application evolves.
- Conduct post-incident reviews to identify areas for improvement in both your application and your incident response process.
- Use the insights gained from monitoring to inform your development priorities and technical debt reduction efforts.
For more information, see: